86 polls conducted & 4768 votes counted
Highest vote count: 75 for No (Poll: Polarizing Provisions, Question: Is cereal a soup?)
Most decisive vote ever: Ice Cream over Frozen Yogurt, 65–11 (Poll: Dessert Match-Ups Part I, Question: Frozen; p = 1.8^{-10})
Most unanimous vote: Curve with a resounding 87.1 % of the votes (Poll: Opposites, Question: What’s the opposite of a straight line?)
Least unanimous (non-zero) vote: Wednesday with 1.09% of the votes (Poll: Week Daze, Question: Favorite)
Most-spurned option ever: Wednesday got just 0.08x its fair share (1 of 92 votes across 7 options; Week Daze - Favorite)
This compares each option’s share of votes to the chance level for its own question (1/k, where k is however many options that question had) — the lowest such ratio, among options that got at least one vote, is comparable no matter how many-way the poll was.
Closest vote(s) ever: a 3-way tie for closest (closest possible result in a 2-way poll — a dead-even 50/50 split) — see the tie tracker tab.
This is scoped to two-option questions only, since a dead-even split is the closest a vote can possibly land. Multi-option ties for the lead are a different kind of tie — tracked separately in the tie tracker — and don’t necessarily mean the overall result was close.
4 questions have ended in a tie for the lead so far — 3 as a dead-even two-option split, and 1 as a shared top spot among more than two options:
| Poll | Question | Split |
|---|---|---|
| Cheese Snacks | cheese snacks | 21-21 (Goldfish vs Cheez-It) |
| Eggs | In a pot | 13-13 (Poached vs Hard/Soft Boiled) |
| Dessert Match-Ups Part II | Cinnamon | 23-23 (Churro vs Cinnamon Bun) |
| Week Daze | Longest-Feeling | 23 votes each, tied for 1st of 7 options (Tuesday vs Wednesday) |
Cumulative Alignment Index between HQ’s and RTP’s vote shares, across every option RTP has voted on (Earth Day → Week Daze): 0.89
This is a different calculation from the per-poll index (see Alignment by poll tab to the right), not their average. It’s asking a stricter question than “did the two offices pick the same winner” – it’s asking whether they were equally enthusiastic about every option. Each per-poll index answers that on so few votes that it can swing wildly: Fair Fare reads as negative even though HQ and RTP agreed on every winner, just with slightly different enthusiasm. This number pools every vote from every poll, so it’s a far more reliable read on how closely the two offices actually vote alike.
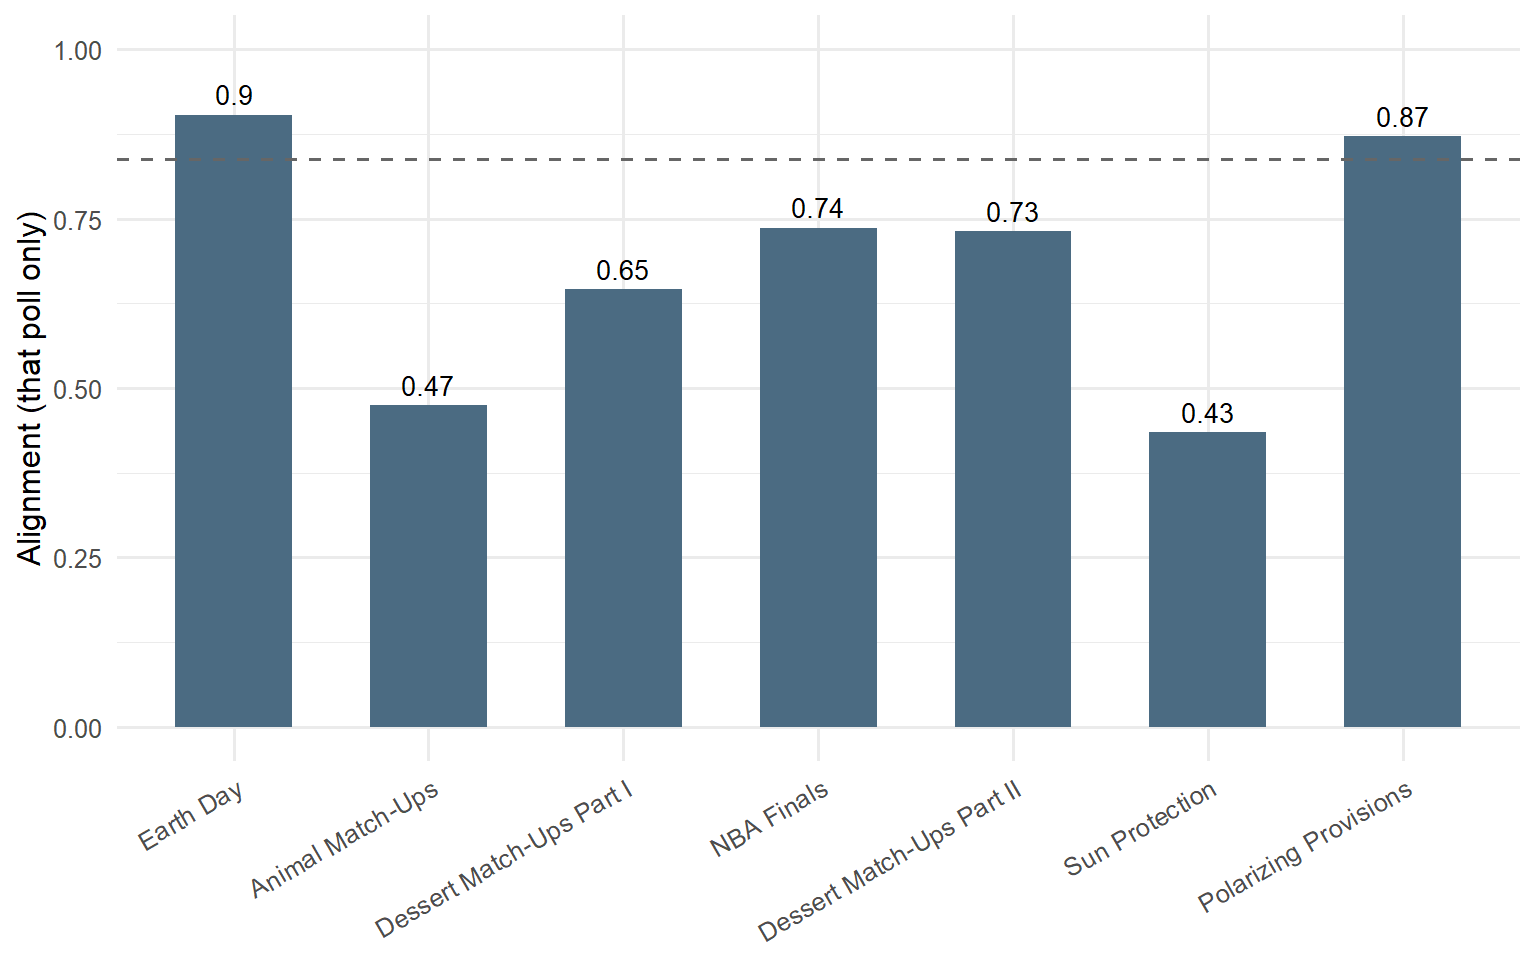
Most aligned poll: Earth Day (0.9)
Least aligned poll: Fair Fare (-0.02)
11 questions where HQ and RTP would have crowned different winners on their own, since RTP joined the poll (see Different crowns tabs for the winners).
Biggest HQ/RTP gap on record: Sunscreen (Sun Protection) — HQ 86% vs RTP 63.3% for Lotion (p = 0.038). It’s also the only office gap that’s cleared statistical significance so far.
This stat requires a shared winner and asks “how differently did the two offices feel about this one thing?”.
The cumulative Alignment Index (see the Alignment section left) pools every option from every poll into one correlation; this instead shows each poll’s own alignment on its own, so you can see how much any single poll’s read can wander from that cumulative figure (dashed line) – see the Alignment section above for why that’s expected rather than a discrepancy.
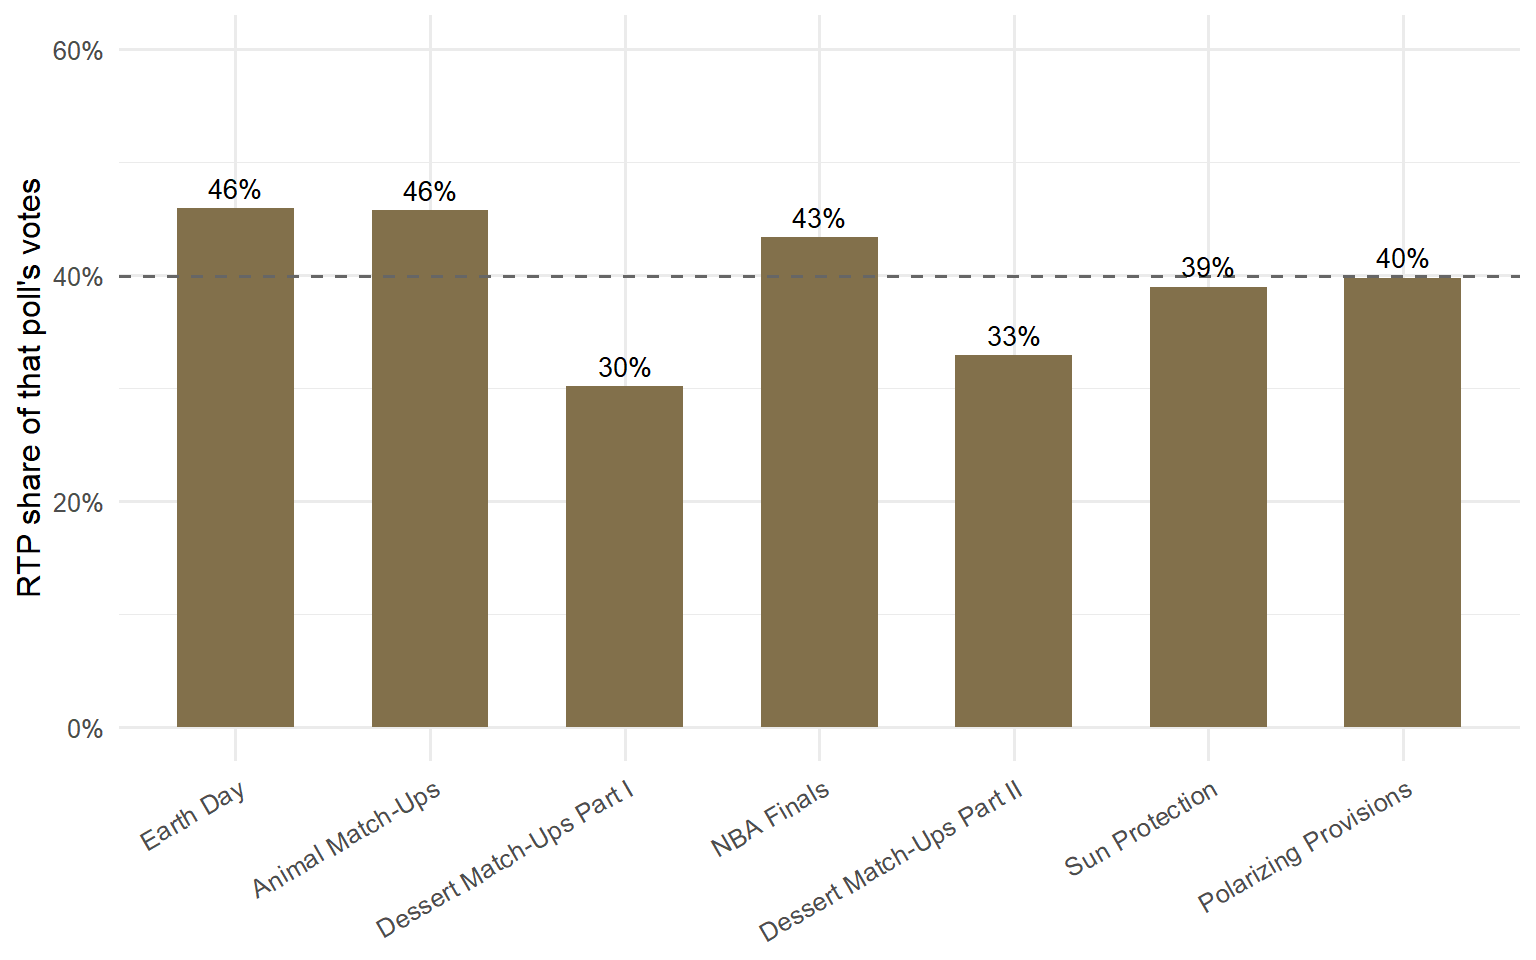
RTP has cast 1384 of the 3521 votes counted since it joined — 39.3% of the total. That share hasn’t trended up or down so much as bounced around a fairly consistent range, poll to poll:
Every question where HQ and RTP would have crowned different winners on their own, since RTP joined the poll – each office’s pick and how far ahead of their own runner-up it was, sorted by the two margins combined, the “Standoff score” (a rough read on how emphatic the standoff was, not on how far apart the offices’ support for the same option was – they didn’t pick the same option here).
| Poll | Question | HQ pick | RTP pick | Standoff score |
|---|---|---|---|---|
| Dessert Match-Ups Part I | Fruity | Pie (+25.5 pts) | Cobbler (+13.0 pts) | 38.5 pts |
| Dessert Match-Ups Part II | Cookie | Macaroon (+21.4 pts) | Macaron (+14.3 pts) | 35.7 pts |
| NBA Finals | Breakfast | Breakfast Taco (+12.5 pts) | Bagel Sandwich (+21.7 pts) | 34.2 pts |
| Earth Day | Volunteering | Invasive Species Removal (+10.5 pts) | Trash Pickup (+17.6 pts) | 28.2 pts |
| Sun Protection | Shades | Wayfarer (+4.5 pts) | Aviator (+21.4 pts) | 26.0 pts |
| Dessert Match-Ups Part II | Tart/Torte | Fruit Tart (+18.8 pts) | Chocolate Torte (+6.7 pts) | 25.4 pts |
| NBA Finals | Catchphrase | “Bless your heart” (+3.2 pts) | “I’m walkin’ here” (+11.1 pts) | 14.3 pts |
| Polarizing Provisions | Is potato salad a salad? | No (+1.8 pts) | Yes (+11.1 pts) | 12.9 pts |
| Week Daze | Most Productive | Wednesday (+3.3 pts) | Tuesday (+9.1 pts) | 12.4 pts |
| Dessert Match-Ups Part II | Cinnamon | Churro (+3.2 pts) | Cinnamon Bun (+6.7 pts) | 9.9 pts |
| Week Daze | Longest-Feeling | Thursday (+3.6 pts) | Tuesday (+6.2 pts) | 9.8 pts |