Cats vs. Dogs
Pets
Woofs and meows, which will prevail?
The age old question, “cats or dogs”, has long been debated. From ancient times, both have been revered as companions, utilized for their hunting prowess, and appreciated for their beauty. But…… how do we feel about them at EPA?
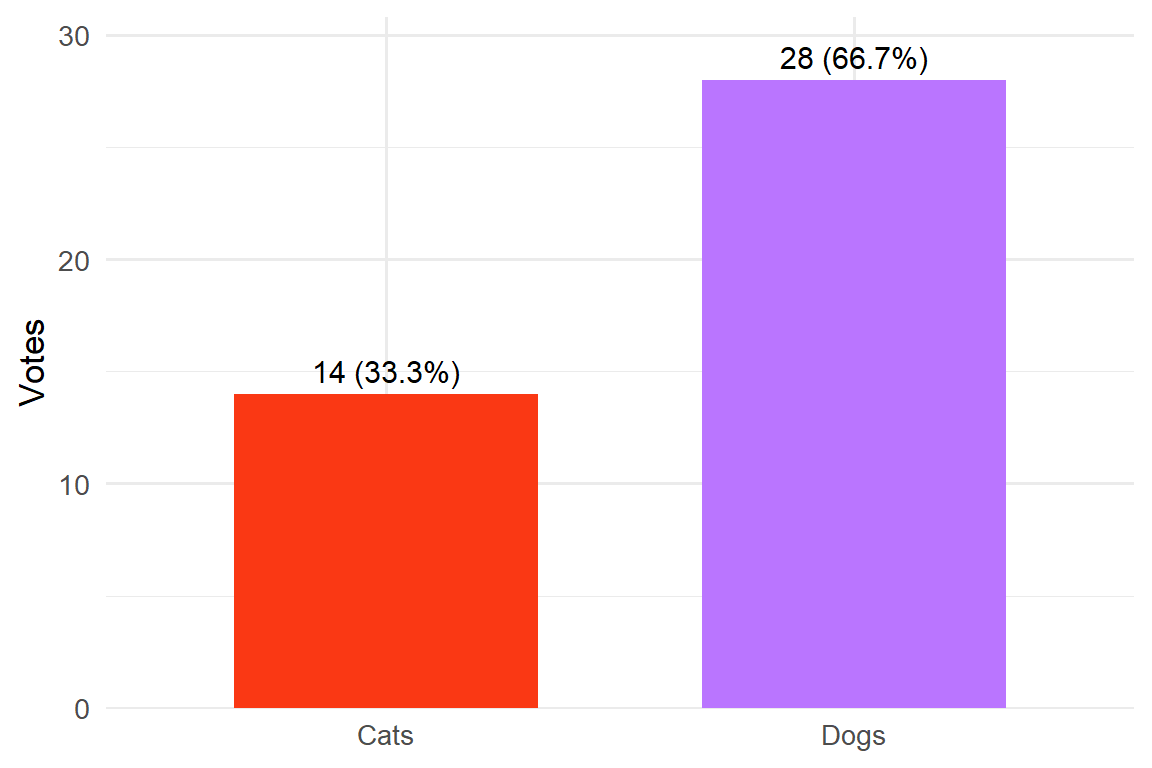
Vote counts and shares
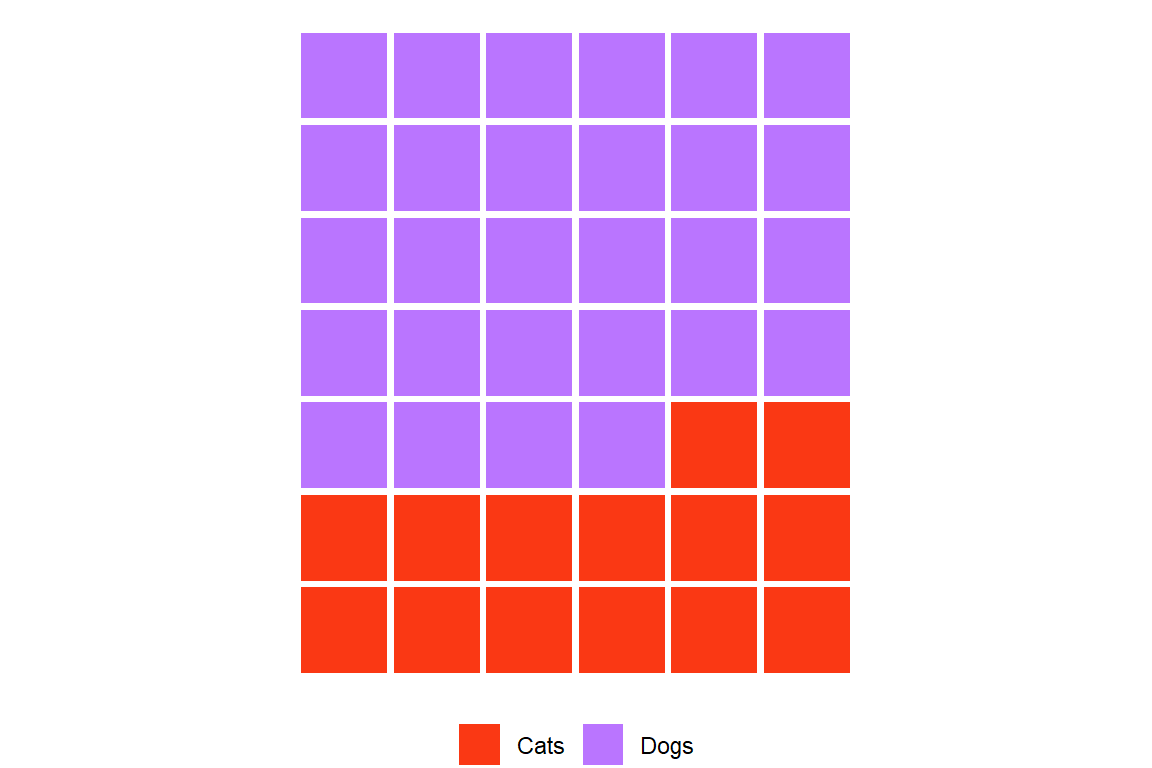
Dogs share: 66.7%, Cats share: 33.3%. Vote margin (Dogs − Cats): 14 votes = 33.3%.
Statistical difference from 50/50
Testing Cats proportion p against 0.5 using an exact binomial test.
    Exact binomial test

data:  14 and N
number of successes = 14, number of trials = 42, p-value = 0.04356
alternative hypothesis: true probability of success is not equal to 0.5
95 percent confidence interval:
 0.1956680 0.4954875
sample estimates:
probability of success
             0.3333333
Two‑sided p‑value: 0.0436 95% exact CI for p(Cats): 0.196 to 0.495
Express the Dogs lead as a margin in share terms, margin = p(Dogs) − p(Cats) = 1 − 2p(Cats). The corresponding 95% CI:
[1] 0.608663904 0.009025071
attr(,"conf.level")
[1] 0.95
Even the lower bound of the margin is positive, indicating a clear preference for Dogs.
How many flips would change the winner?
To tie, you’d need 7 votes to flip (7 Dogs → Cats). To give Cats a lead, you’d need 8 flips (8 votes).
How unusual is 14-28 under a fair 50/50 world?
Under p = 0.5 with N = 42, the probability to be at least this far from 50/50 (two‑sided) is the binomial test p‑value.
We can also simulate the Cats counts under 50/50:
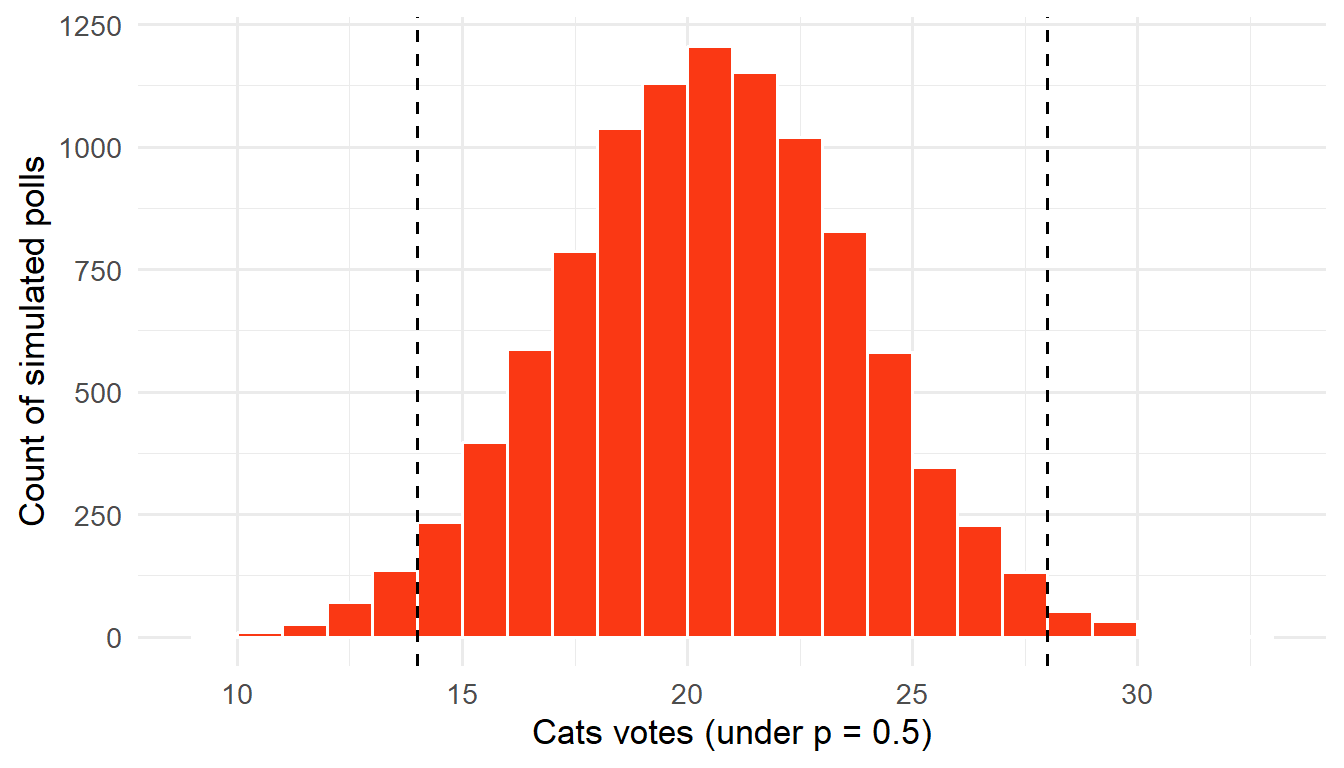
Fraction of simulations at least as extreme (two‑sided):
[1] 0.0464Likelihood and Bayesian view for the Cats share
Binomial likelihood for p(Cats) given 14 out of 42 votes:
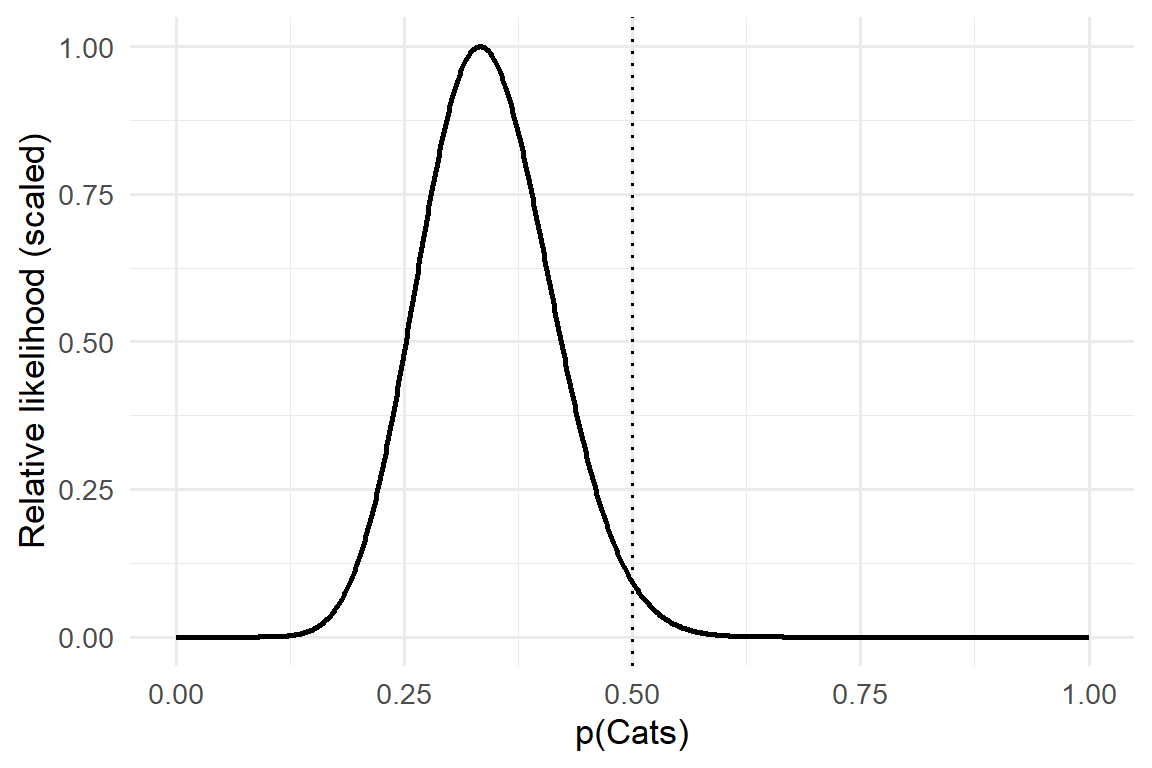
With a flat prior Beta(1,1), the posterior is Beta(15,29). Credible interval and the probability Cats < 0.5 (i.e., Dogs lead):
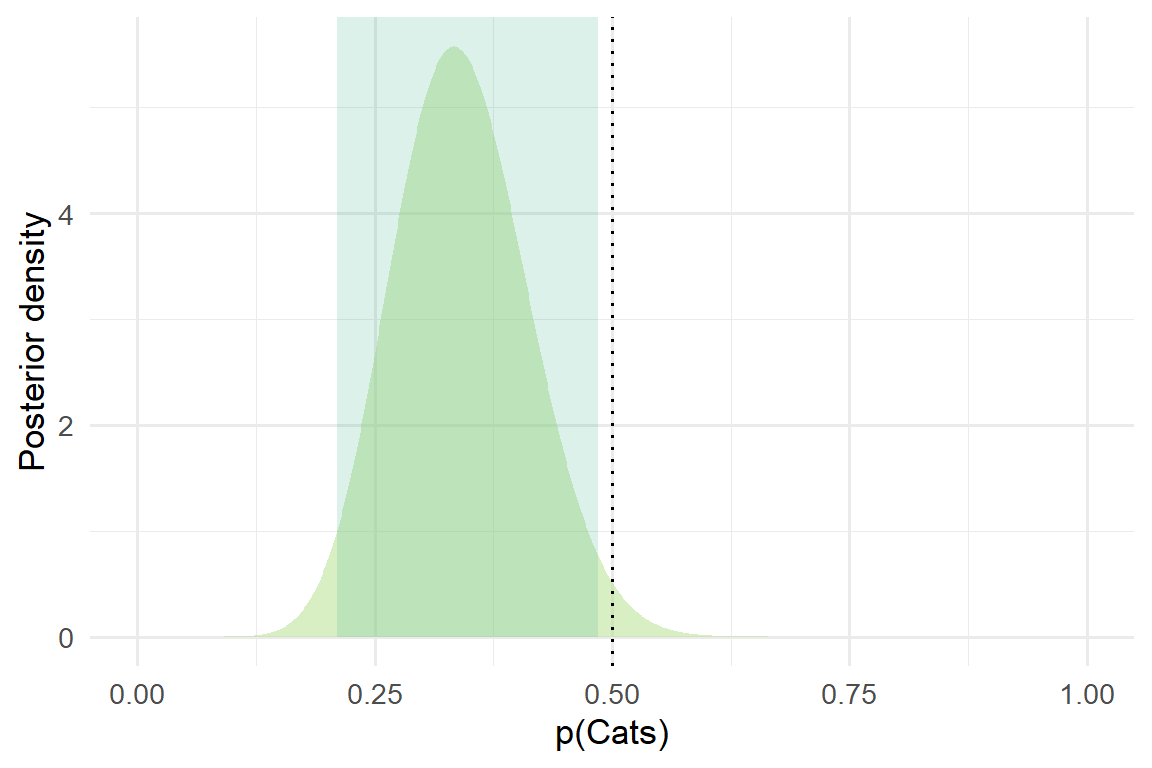
95% credible interval for p(Cats): [0.210, 0.485]
Posterior probability Dogs lead (p(Cats) < 0.5): 0.9842
Posterior predictive for a repeat poll of size 42: chance Cats win, tie, or Dogs win.
pp_cat_win     pp_tie pp_dog_win
    0.0517     0.0270     0.9213
Bayes factor for “not 50/50” vs “p = 0.5” using Jeffreys prior Beta(0.5,0.5).
[1] 1.319843BF10 > 1 supports “not 50/50”; values around 3–10 are often called “moderate” evidence.
Effect sizes and ratios
risk_difference      risk_ratio       odds_dogs        cohens_h
      0.3333333       2.0000000       2.0000000       0.6796738
Dogs lead by 33.3% in share. Dogs have about 2:1 the share of Cats and odds about 2:1. Cohen’s h ≈ 0.68 (medium‑to‑large difference; 0.2 small, 0.5 medium, 0.8 large).
Waffle chart (one square per voter)
Takeaways
Dogs win clearly: 28–14 yields a Dogs margin of 33.3%.
Exact binomial test vs 50/50 is significant (p ≈ 0.0436), and the 95% CI for p(Cats) lies below 0.5.
A fair coin process would rarely produce a result this lopsided for N = 42.
Bayesian analysis strongly favors a Dogs lead and predicts Dogs would likely win a same‑size repeat poll.
To tie you’d need 7 flips; to flip the winner, 8 flips.