Cheesy Snacks
Food
Dairy filled crunches
Well folks, its a tie. What can we glean from a boring 21-21 tie?
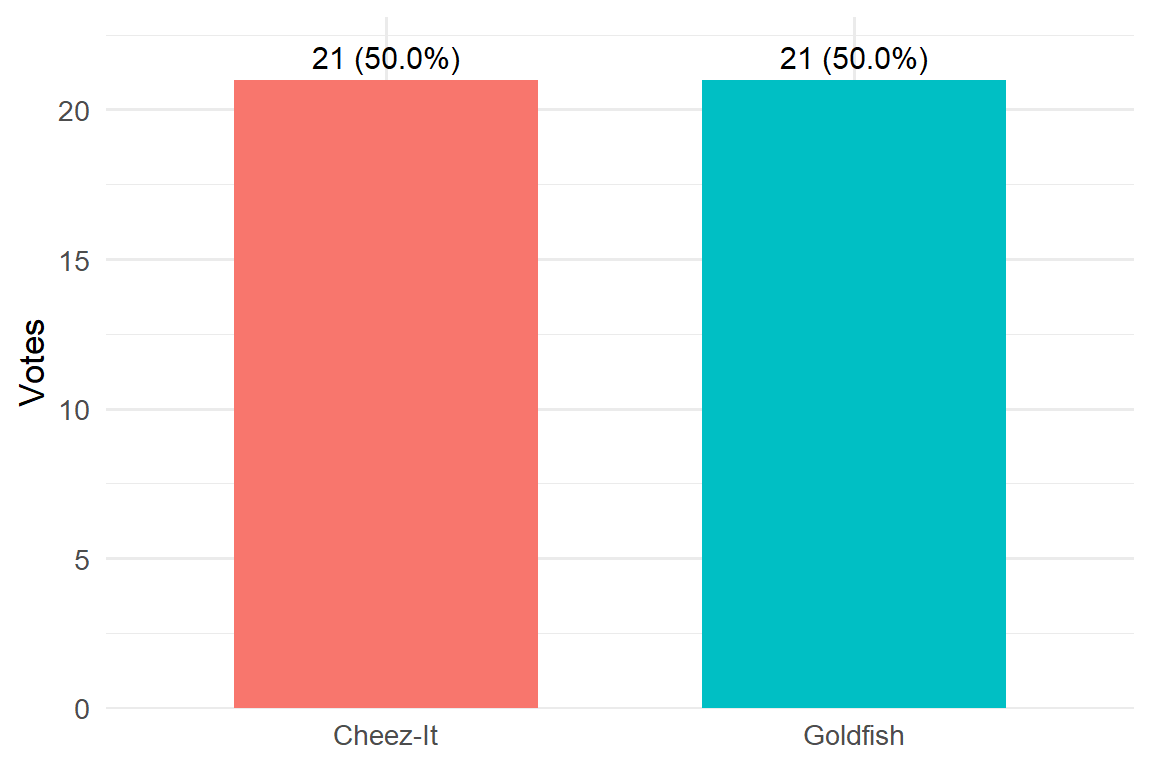
Vote counts and shares
Inference: does anyone lead in the poll?
The natural null here is p = 0.5 for Cheez-Its, with N = 42
    Exact binomial test

data:  21 and 42
number of successes = 21, number of trials = 42, p-value = 1
alternative hypothesis: true probability of success is not equal to 0.5
95 percent confidence interval:
 0.3419476 0.6580524
sample estimates:
probability of success
                   0.5
The p-value is 1, a perfect tie gives no evidence either way. The 95% exact CI for the Cheez-Its share p is:
[1] 0.3419476 0.6580524
attr(,"conf.level")
[1] 0.95
We can also express uncertainty for the vote-margin (Cheez-Its minus Goldfish share). Share margin = 2p - 1, the 95% CI for the margin is just 2 x CI(p) - 1:
[1] -0.3161048  0.3161048
attr(,"conf.level")
[1] 0.95
Probability of a tie if it really is a fair 50/50 world of Cheez-Its and Goldfish
If each of the 42 voters is a fair coin flip, the probability of a tie is:
[1] 0.1223857That’s about 12.2%. Ties are not rare with samples this small.
What margins should we expect with N = 42 at p = 0.5
Simulate many polls of the same size from a fair process and look at the margin in votes.
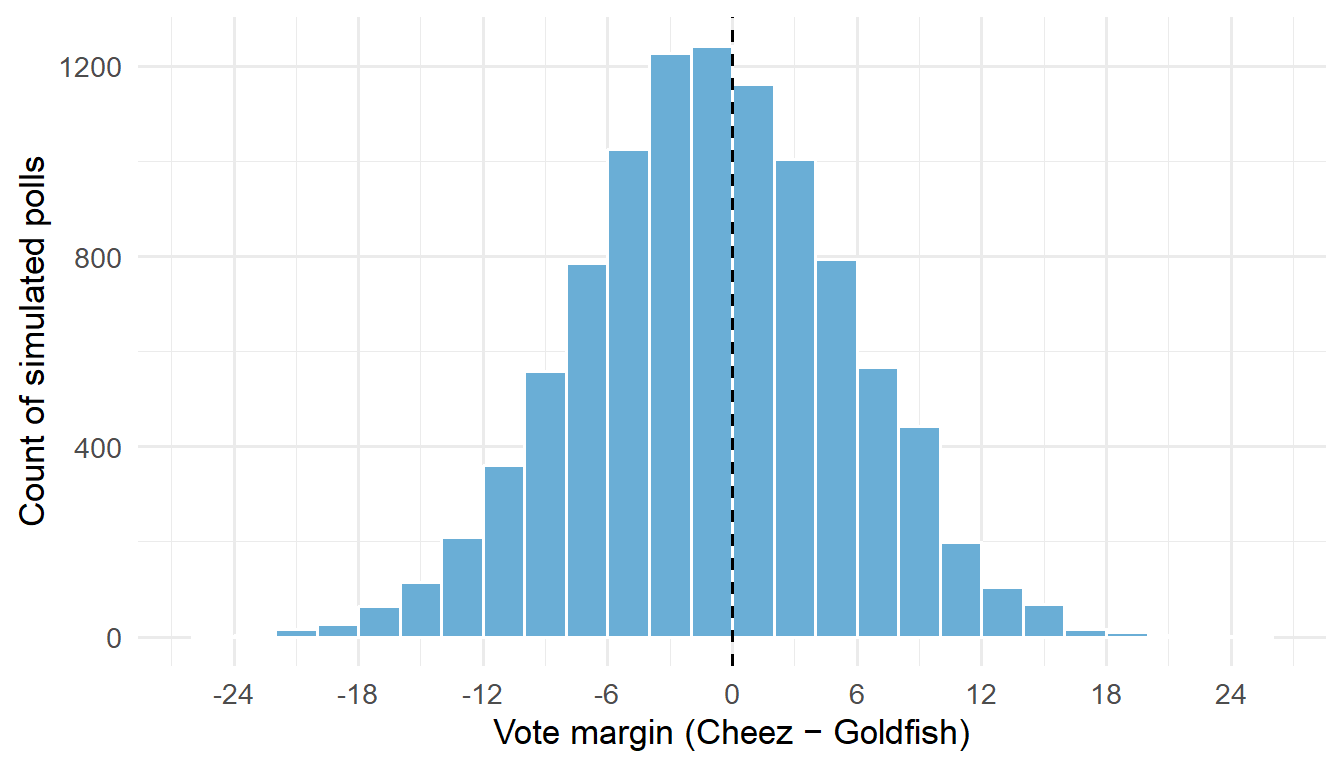
What fraction of simulated polls tie?
[1] 0.1195Likelihood and Bayesian view for the Cheez-Its share
The binomial likelihood for p given 21 successes in 42 trials:
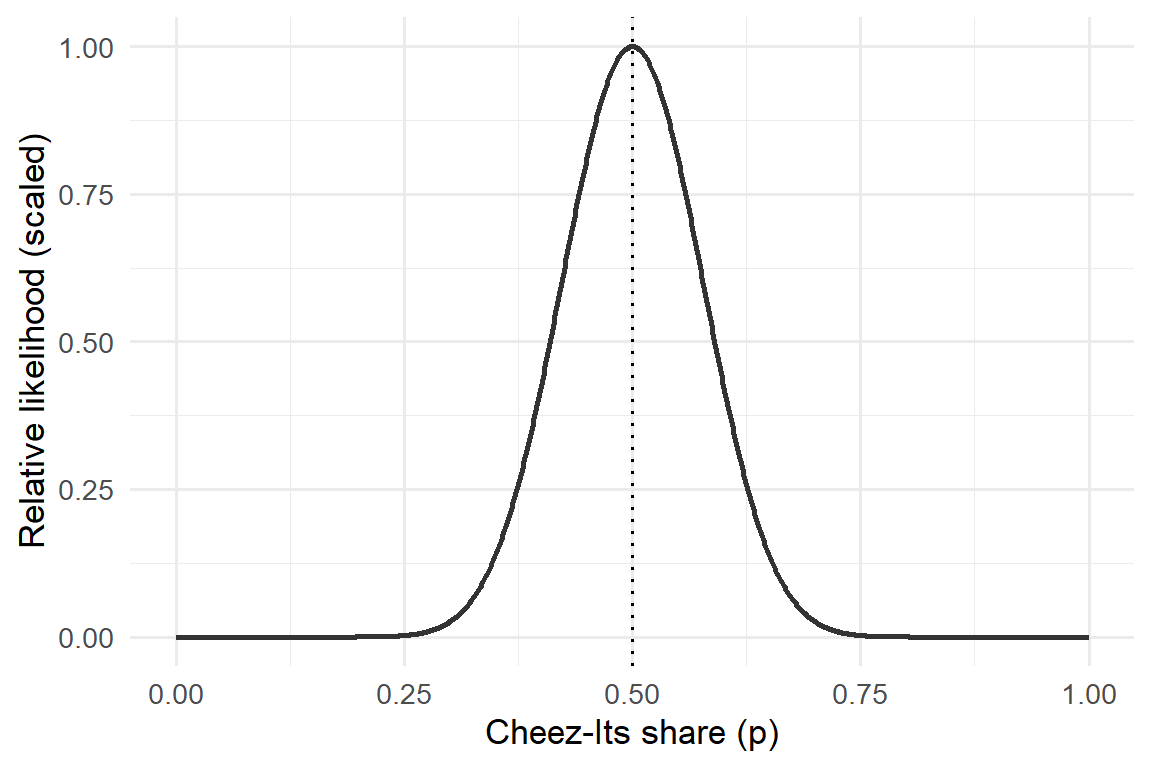
If you use a flat prior Beta(1,1), the posterior is Beta(22,22). The 95% credible interval and posterior density:
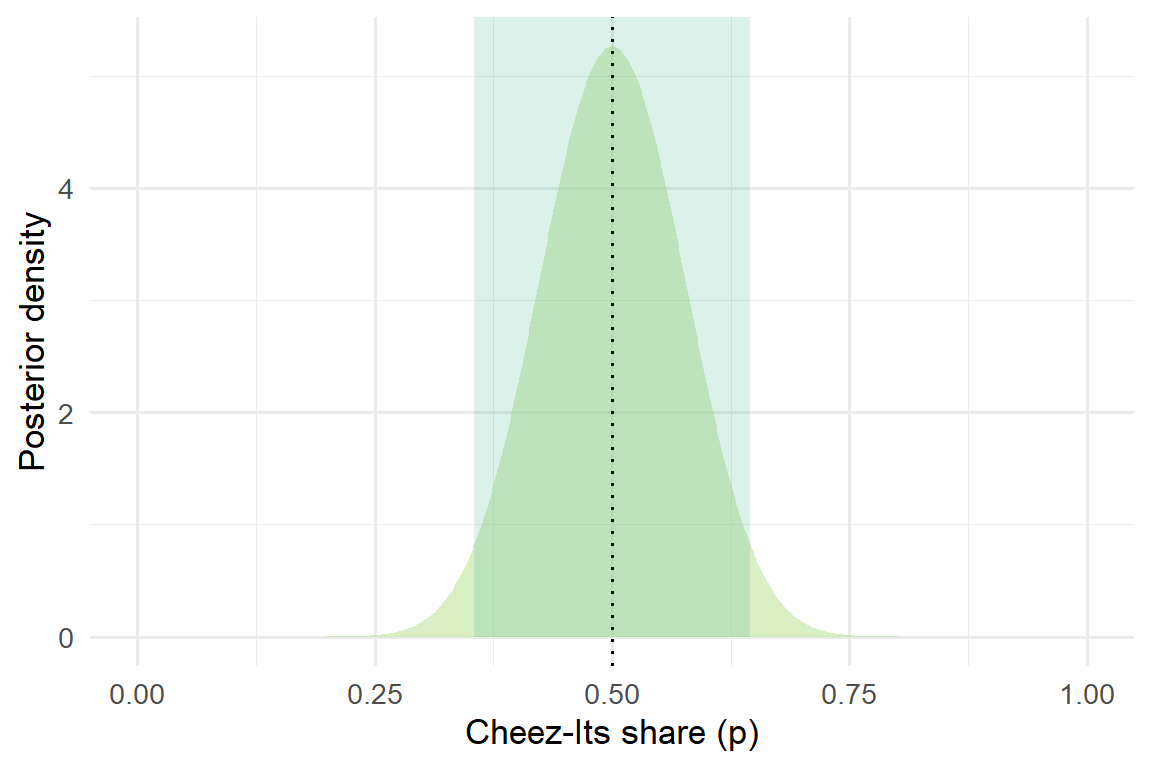
The posterior probability that Cheez-Its leads (p > 0.5) under this symmetric prior is exactly 0.5.
[1] 0.5Effect size: Cohen’s h for proportions
Cohen’s h = 2asin(sqrt(p1)) − 2asin(sqrt(p2)). With p1 = p2 = 0.5, h = 0 (no effect).
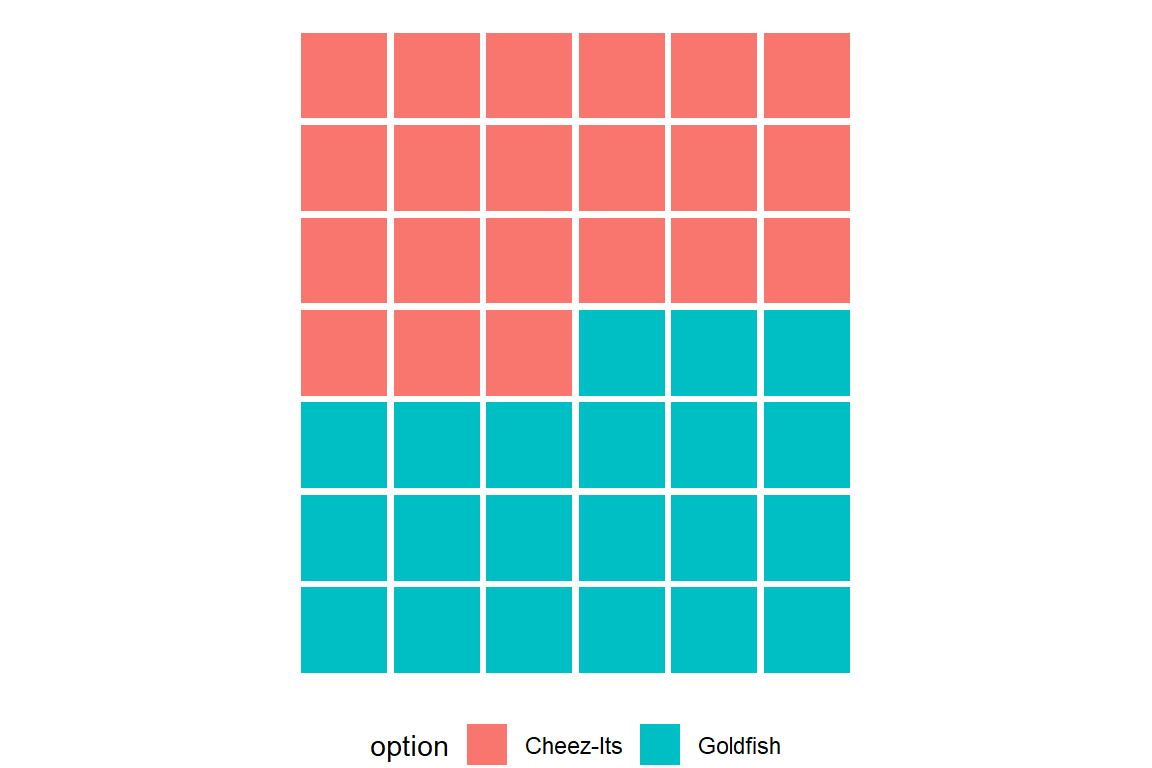
[1] 0Lets try a waffle chart (one square per vote)
Takeaways
It’s a dead heat: 21–21 gives no evidence of a lead.
With N = 42 and a true 50/50 split, ties happen about 12.2% of the time.
The 95% interval for the Cheez-Its share is wide (reflecting a small sample).
If you repeat this poll weekly at the same size, expect margins to bounce around—even with no real preference.